

How tos
How to control blocks and performance on SQL?
- Author
- Alain Krikilion (alias kriki)
- Website
- http://mibuso.com/blogs/kriki
- Date
- 03/04/2008
- Size
- 23,28 KB
- Downloads
-
2907
Detailed statistics
- Downloads today 0
- 30 day downloads 11
- Total downloads 2907
- Overall download rank #256 / 2082
- Today page views 0
- 30 days page views 3
- Total views 14156
- Rating


 Detailed statistics
- x 1 12,50%
- x 4 50,00%
- x 2 25,00%
- x 0 0%
- x 1 12,50%
- Popularity
- Downloaded 5 times in the last two weeks
On SQL you can use traces to find out what the heavy (in time of duration/reads/writes) queries are and also to record blocks. But we don’t know which programs cause them.
To know this, we should use the client monitor that gives us the heavy queries and the exact place in the programs where they are used.
In this case, we should constantly run the client monitor on ALL clients. And even if we do this, we still have problems determining which programs block each other.
And also: running the client monitor or the traces do have some performance implications.
So to have some idea where to start, we need to know which programs cause problems and also when. But we can’t be constantly looking at the traces generated at the moment and then asking the users what they are doing.
With this form, which you can run on a Navision session, you constantly monitor what is going on and when there is some heavy activity or a block, it informs you by beeping. At this moment you can check what is going on and call the persons of the sessions who cause the heavy activity or are blocking others or are blocked by others. Ask them what program they are using. After some time, you can have some idea of which programs have some problem. If you then confront the data collected by the traces, you can also find the table which causes the heavy activity and knowing which program and which table causes the problem, you can easier find the code in the program. Or you can start a client monitor and run the program and see what happens.
It is not a “magic” solution to find the performance problems, but it is yet another tool to help fighting performance problems.
Main form:
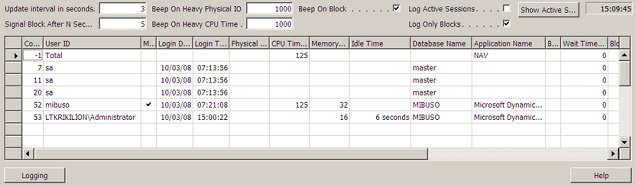
- Some info:
- The form is based on table “Sessions”.
- Fields:
- “Update interval in seconds”: how long to wait before updating the form
- “Signal Block after N Seconds”: How long (field “Wait Time (ms)) a block must be active before the form considers it a block.
- “Beep on Heavy Physical IO”: when the total Physical IO is over this value, a beep will be given. Depending on your server-hardware, you can increase/decrease this value. On some systems 1000 is HEAVY, but on others (with LOTS of disks in RAID10 for the DB) it is not heavy at all).
- “Beep On Heavy CPU Time”: when the total CPU is over this value, a beep will be given. Depending on your server-hardware, you can increase/decrease this value.
- “Beep On Block”: TRUE: when there is a block, a beep will be given. FALSE: No beep will be given
- “Log Active Sessions”: You can also log active sessions in a temptable for later analysis. Active means it has some Physical IO or CPU time since last update.
- “Log Only Blocks”: You can decide to log only the blocks and not all active sessions.
- Button “Show Active Sessions”: Shows the log of active sessions. This opens another form. See below for more info.
- Button “Logging”: If you want to monitor a certain session, select the session and hit this button.
Button “Show Active Sessions”:
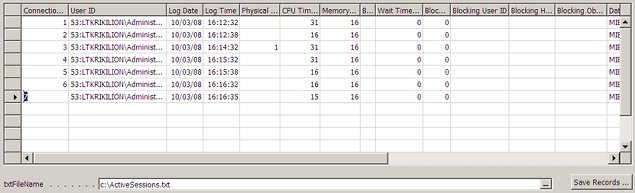
- Some info:
- This form is based on a temptable. If you close the main form, the data will be lost.
- This temptable logs all sessions when the session had some activity. So it is possible this table increments fast. A good idea is to regularly save the data to a file.
- Fields:
- “txtFileName”: the name of the file to which to save the data.
- Button “Save Records to File”: this will flush the temptable and write the records to the file “txtFileName”. If the file already exists, the records will be ADDED to it. The file is tab-separated. After the records have been written to the file, they will be removed from the temptable.
Button “Logging”:
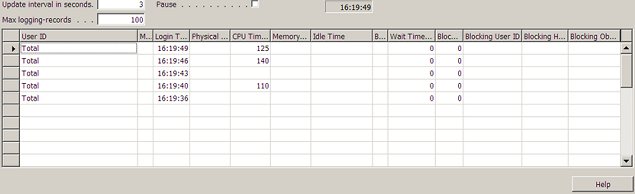
- Some info:
- This form is based on a temptable. If you close the main form, the data will be lost.
- Monitors a certain session over time. Multiple “Logging”-forms can be opened on different sessions.
- Fields:
- “Update interval in seconds”: you can change the update interval in which to save a sample.
- “Max logging-records”: you can limit the number of records kept in the temptable. When this is reached, the oldest will be deleted
- “Pause”: you can pause the logging so it is easier to view the data.


